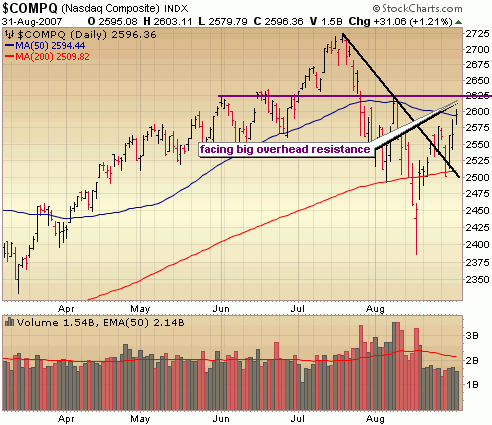
Let’s have a look at the Nasdaq. When I say that the major indices have improved technically I’m specifically referring to the breach of their downward trend lines. There has been no trouble with this area of resistance as you can see in the Nasdaq in the chart below. However, big overhead resistance looms around the 50 day moving average and previous highs around 2625. There is some room for the Nasdaq to push higher, but I think this bounce will be exhausted soon.

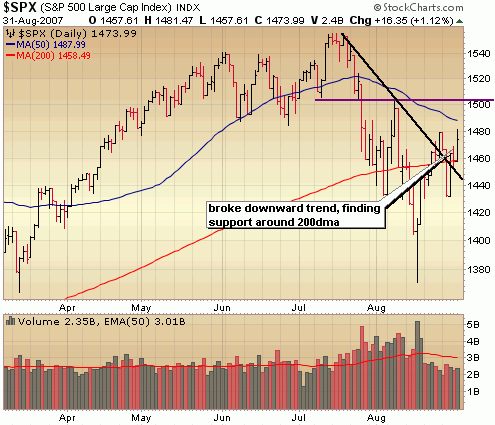
The S&P has shown some strength too by clearing the downward trend line (in black) but key resistance areas are on the horizon at the 50 day moving average and then around the August highs of 1500. The downward trend line may prove to be a new area of support so look for the S&P holding above this line as an indication of underlying strength.

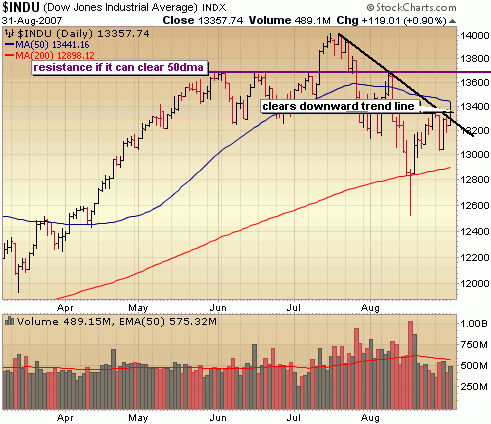
The Dow just cleared its downward trend line on Friday, so it’s lagging a bit. Notice it hit resistance right at the 50 day moving average on Friday and retreated.. a sign that the push higher may be running out of gas. If the Dow can clear Friday’s high we could very well see another couple hundred points higher to the next level of resistance around 13700. I would be might tempted to short the heck out of the market if it gets anywhere close to this level next week.

::: Best/Worst Performers :::
– Top 10 Performing Industries For the Week –
1. Home Improvement Stores: 6.35%
2. Aluminum: 4.50%
3. Major Airlines: 3.75%
4. Beverages – Brewers: 3.70%
5. Diversified Computer Systems: 3.60%
6. Personal Computers: 3.60%
7. Jewelry Stores: 3.50%
8. Broadcasting – Radio: 3.40%
9. Heavy Construction: 3.30%
10. Printed Circuit Boards: 3.00%
– Top 10 Worst Performing Industries For the Week –
1. Toy & Hobby Stores: -7.10%
2. Residential Construction: -5.75%
3. Surety & Title Insurance: -4.90%
4. Mortgage Investment: -3.75%
5. Banks – Pacific: -3.40%
6. Banks – Southeast: -3.00%
7. Investment Brokerage: -3.00%
8. Banks – Northeast: -2.70%
9. Banks – Mid Atlantic: -2.70%
10. Banks – Midwest: -2.65%
– Top 5 Best Performing ETFs For the Week –
1. Greater China Fund (GCH) 11.55%
2. Powershares China (PGJ) 5.30%
3. Ishares China (FXI) 4.65%
4. Claymore Bric (EEB) 4.05%
5. US Oil (USO) 4.00%
– Worst 5 Performing ETF’s –
1. Thai Fund (TTF) -4.60%
2. US Natural Gas (UNG) -4.35%
3. Ishares Home Construction (ITB) -3.50%
4. KBW Bank (KBE) -3.05%
5. Malaysia Fund (MAY) -2.85%
::: IPO’s Worth Watching for This Week :::
No IPO’s scheduled for the next couple weeks.
::: Upcoming Economic Reports (9/3/07 – 9/7/07) :::
Monday: Holiday
Tuesday: Construction Spending, ISM Index, Auto/Truck Sales
Wednesday: Pending Home Sales, Fed Beige Book, Crude Inventories
Thursday: Initial Claims, Productivity (revis), ISM Services
Friday: Nonfarm Payrolls, Unemployment Rate, Wholesale Inventories
::: Upcoming Notable Earnings Reports :::
Tuesday:
Guess (GES), Mobile TeleSystems (MBT)
Wednesday:
J Crew (JCG)
Thursday:
Smith & Wesson (SWHC), Verifone Holdings (PAY), Focus Media (FMCN)
I too am waiting on this market. Given the fact that company fundamentals are still so strong, I can’t bring myself to short this market, but I also don’t want to be all in, especially before the FOMC meeting.
Agree – I’m 100% cash; I’ve jumped in and out of equities and made a few bucks but on sidelines now. I don’t think we have heard the last of the sub-prime contagion.