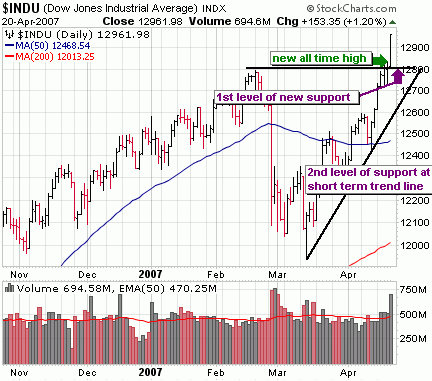
The most glaring thing I see in this chart is the severe V shaped base that has formed. Based on that alone, this market is very much due for some kind of pull back, or at the very least, a lengthy consoliation sideways. With the Dow breaking into new high territory we now have a new support level at the old highs around 12800. If it can consolidate quietly from here and hold at those all time highs, that would be mighty bullish action. I tend to think we’ll take out that support level at some point and test the short term upward trend line around 12700, possibly even the 50 day moving average around 125000. I don’t think we’ll test the lows of the correction below 12,000.

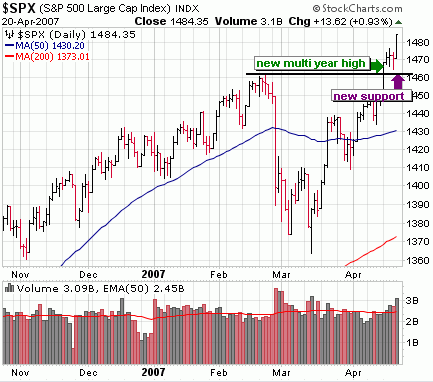
The S&P of course will look very similar to the Dow so not much to add here. Notice too it has a new level of support at the old multi year highs set back at the end of February. We’ll need to, at the very least, test that new level of support before heading higher.

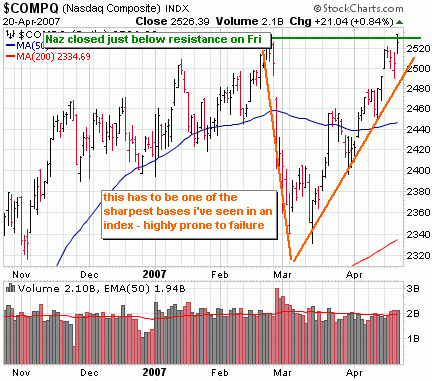
I’ve highlighted the sharp V base in the Nasdaq. It is quite rare to see this kind of base in any chart, particularly a chart of the major indices. The Naz isn’t as bullish looking as the Dow and S&P and has not cleared resistance of the February highs (although it briefly peaked above that level on Friday). The Nasdaq is clearly due for some selling and retracing a large portion of this run up to around the 50 day moving average is not out of the question.