Question:
What is a pennant pattern? I thought that a flat base was your favorite chart?
My Response:
I should have said one of my favorites.. flat bases are right up there too. I dont go into these patterns in the tutorial..I’ve been meaning to add them. In the meantime have a looks at these pages:
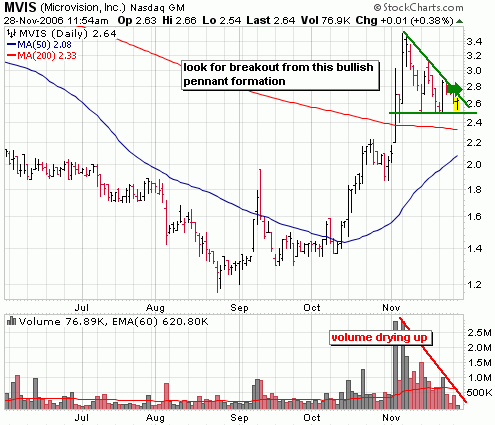
The pennant formation is characterized by a large volume spike in price over a few days followed by consolidation where price converges and volume diminishes often resulting in a breakout in the direction of the previous trend. A picture will provide a much better explanation. I’ve found a few useful links below that describe this formation. You’ll also want to take a look at any of the past Stock Watch reports that I’ve sent you. I usually highlight a couple of these formations in those reports.
Here’s one example from a Stock Watch report back in November:

http://www.trending123.com/patterns/bullish_pennant.htm
http://wmt.bloggingstocks.com/bloggers/larry-schutts/
(this post looks at one stock, SPRT that I also like very much.. waiting for a break out move with volume – this pattern also illustrates a great looking pennant formation)
do you have any info on bearish pennant formations. just notice symbol fnm was in a bearish pennant.what happens when it sells off the second time thanks in advance