I think it’s safe to say there is a lot of crap training out there when it comes to the stock market basics, especially if it’s free. Well, every once in awhile there is a great free course that comes along that actually provides some great content without the fluff. It’s important to note that this stock market training course courtesy of INO goes beyond the basics to some degree so some aspects may not make much sense right now to the newbie… That’s ok. Sign up for it, save it and go over it a few times. You might even think about coming back to it every few months as you develop your stock market skills. Below is an outline of the course, but if you’re ready to get started now, you can get it right here
Not Just The Stock Market Basics – “The Secrets Of Professional Floor Traders” Trading Course
Get the FREE course in its entirety here
1.The Right Attitude
– Be focused
– Money Management
– Cut the Loser, Let the Winner Ride
2. The Trend is Your Friend
– Buy on the dips in a bull market, sell into rallies in a bear market
– The importance of knowing the big trend and working in
– Two key mistakes beginners make in reading trends
3. Chart Patterns – Trading Gaps & Watching For the Reversal
– Gaps reveal clues to strength and weakness.. know the different types
– Which “key” chart pattern reveals a top or bottom is near?
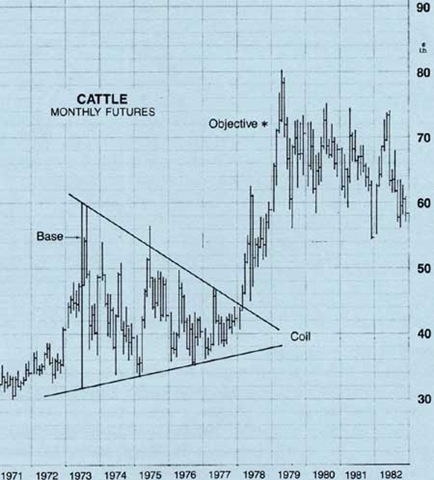
4. The Most Reliable Chart Patterns Revealed
– Some of my favorite chart patterns revealed in this lesson. If you read no other lesson, be sure to read this one.
– Here’s one example:
5. Adding the Moving Averages To Your Arsenal
– Perhaps the most basic and certainly one of the most important technical indicators to place on your charts
– In my opinion, this lesson should have been expanded further but it’s a decent introduction
– Discover Adam’s technique for deciphering a trend change using multiple moving averages
I’m Ready, Get Me The FREE trading course!
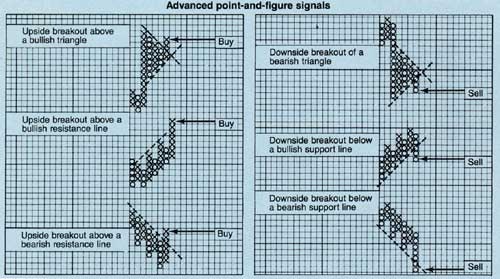
6. Point & Figure Charts
– not many people use point and figure charts anymore, but some still swear by them
– Adam believes it provides clearer signals and he shows you how to read them in this lesson
7. Helping To Identify A Top & Bottom – The RSI Indicator
– the best way to configure RSI
– how the RSI is calculated
– find out how the RSI reveals that top or bottom is close
8. One Of My Favorite Indicators – Stochastics
– another oscillator that can help identify a top and bottom
– how to use stochastics to spot a top and bottom
– careful of using stochastics in this kind of market..
9. The Average Directional Movement Index (ADX)
– the oscillator indicators such as RSI, Stochastics don’t work as well in strong trends
– the ADX can help keep you in a strong trend
– when the ADX hits this number and turns down, time to get off the train!
10. Market Cycles
– this particular lesson discusses commodity cycles, but there are many other market cycles at play
– this is probably a good area of research for you
– I’ll get you started.. historically, the strongest period of the stock market is typically in the month of Nov – Jan. May and September are usually poor months. Some individual stocks even have definitive cycles.
This really is one of the best free trading courses around, so you owe it to yourself to check it out. Get it here.