With gold breaking out of a 1.5 year base in recent weeks, it’s certainly been the focus of much discussion once again. How high will it go? Are we about to enter a mania phase? What’s the best way to play the sector? I thought I’d enter the fray and tackle some of these questions, primarily from a technical perspective. In this article I take a look at the SPDR Gold Trust ETF (GLD) in order to get an overview of where gold has been and where it might be headed. In Part II, which I’ll post towards the middle of the week, I’ll take a look at a few gold stocks that I think represent a good leadership group. That is, companies that are profitable and in some cases growing quickly. To close out the series, I’ll post another article later in the week or next weekend taking a look at several speculative gold plays based purely on momentum. These are trades that carry considerable more risk and potentially much greater reward.
With that, let’s jump into a couple charts of GLD which I think are quite revealing.
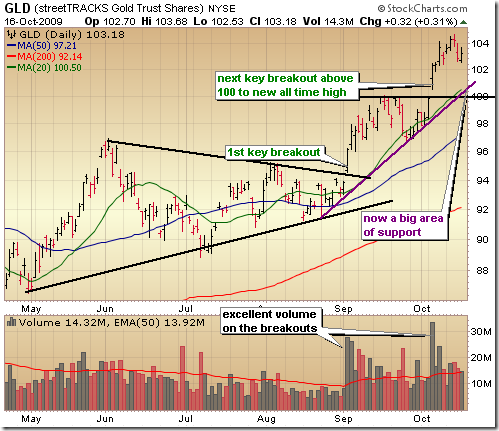
The first one below is the shorter term chart showing two very bullish moves in September and then again here in October. The first big move that really kicked off this rally in gold was the Sept 2nd breakout out of a bullish wedge formation. After a short consolidation, it eventually broke out again, this time to a new all time high above that all important 100 level. Note the big pick up in volume on the buy side which indicates quite a bit of conviction on the part of buyers. I do think gold is a bit extended in the short term and probably needs to trade sideways or even pull back to 100 over the next few weeks. That should be enough to clear the way for the next and possibly final leg up of this strong up trend.
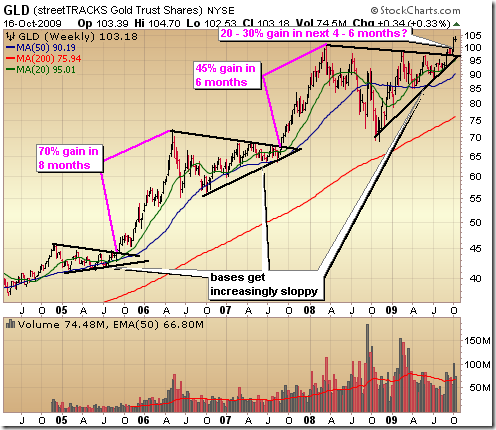
There are all kinds of estimates on how high gold will go. It’s quite similar to what was happening in 2007 when the price of oil skyrocketed into the stratosphere. My feeling is that there is certainly room to run in gold, but we are much closer to a big top in gold then another big run (like we saw over the past nine years). In the chart below, I only show the move since 2005, but the big move in gold really began back in early 2001 when it was just $275/oz. Despite what many of those selling gold products and trading services will tell you, it appears the move in gold is largely done.
If you take a look at the quality of the base formations at the end of each leg up, what you’ll see is a significant increase in the depth and sloppiness of the base. It reveals that an increasing number of people are watching and trading gold. Just see how long it takes for a gold commercial to come up on any business channel! When that happens, the mega move is largely over. What I see happening is some kind of climactic run in gold over the course of a few months with gains of 20 – 30%. That’s not a number pulled out of a hat, but based on previous runs from previous bases. Notice how the farther up you get into the rally, the returns diminish as the base quality deteriorates. Take a look at any big move in a stock and you’ll see this similar pattern. It’s reasonable to assume that the returns from this breakout will be less than what we saw with the 2007 breakout.. so somewhere around 20 – 30%. If the price of gold gets into that 1200 – 1300/oz area I’d be looking for some major topping action! A climax run in gold over the next few months followed by massive selling on the part of institutions may be the end of a nearly 10 year bull run in gold. Get more gold analysis here


Looking back at how off the mark this was you would think… why? This made good common sense why didn’t it top out? Problem is the word ‘spending’ doesn’t occur once during this article. The gov is printing money and devaluing the currency very rapidly now. We are all being robbed blind by inflation and it’s getting worse.