What week. With the Fed throwing an unexpected hail mary pass at the credit crisis, the indices did indeed surge right into major resistance levels with a quick 20% move similar to what we say last October and November.
An email I sent out to members on Thursday night sums up my thoughts for the week, so I’ll just post that…
“In my last email to you on Monday the market had just put in a high volume reversal day to the downside with significant volume. It appeared this market needed to pull back a bit before making a serious run at the major resistance levels I’ve been talking about (Dow 7500, Nasdaq 1500 and S&P 800). Ah, but the bulls still had some serious fight left in them. The very next day, some morning weakness gave way to a flurry of late day buying and the indices took out the highs of the previous day. Immediately taking out the highs of a high volume reversal day the very next day is a rare event and it signaled significant strength to this rally, setting the stage for a run into major resistance levels with little pause. Admittedly I was caught of guard a bit so didn’t capitalize as well as I had hoped to on Tuesday and Wednesday.. such is trading. You play the odds when they’re in your favor and accept the fact that perfection is far from possible.
So what now? Well, let’s start by muting those so called pros on CNBC waving the pom poms urging you to get into this market right now. Yes, it’s possible the low of early March was “the” bottom but that won’t be revealed until well after the fact. Let’s keep in mind that the market vaulted 20% in little more than one week, running smack into major resistance levels AND this is still a bear market. Chasing this rally up here is a mistake. Fearing missing a rally is just about as detrimental to your financial well being as panicking at bottoms, so the financial surgeon general says “you have been warned.”
As for Ben Bernanke’s bold move yesterday, here are my thoughts that I sent out to Gold members last night..
Helicopter Ben is certainly living up to expectations, willing to print and print and print our way out of this mess. The Fed
announced another $750 billion for mortgage backed securities, $300 billion for longer term Treasury securities over the next 6 months and another $100 billion in agency debt. It doesn’t even seem like real money anymore, just numbers. The amount of money our government is throwing at this is truly staggering and unprecedented. Whether Ben’s years of studying the Great Depression and his solution for avoiding another one will work may not be known for many months, but one thing is certain now.. the man has courage in his convictions and you have to respect that. BUT.. Does it signal desperation? Is this the hail mary pass into the corner of the end zone with time running out? Time will tell.
Yes, there will be tremendous consequences of this down the road (no free lunch!) Bernanke himself has expressed concerns about the difficulty in unwinding this with rate hikes. We can only hope he’s one helluva magician and avoids rampant inflation. Considering what gold did today, traders have their doubts as do I. As for what this means for the overall market right now, it’s difficult to say because the indices closed in the upper half of the trading range with heavy volume indicating further momentum. However, the indices hit right on the lines of major resistance before significantly pulling back and we are quite overbought. This move in the past few days does nothing to erase the bear market, so chasing this rally up here is
mistake in my opinion.”
Let’s turn to the charts…
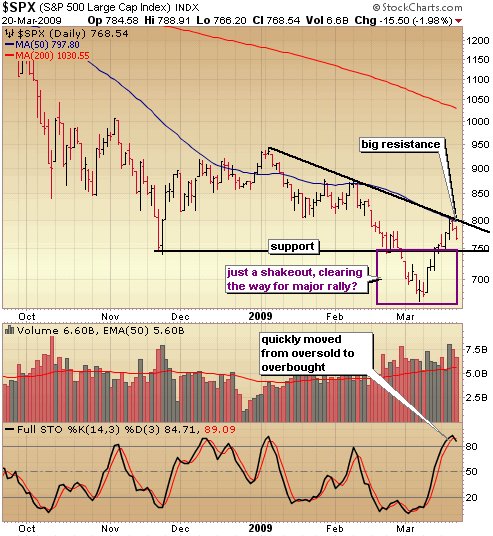
The first thing to point out this week is that the indices are quite overbought up here. . just as overbought as they were at the November and January peak. Yes, the indices can remain overbought for awhile so we need to pay attention to price and volume in the coming days as well as intraday support and resistance. The big line in the sand right now for the S&P500 on the resistance side is 800. It happens to be the 50 day moving average, the downtrend line for 2009 AND psychological resistance, so it will be a very difficult area to get through and hold above. The pull back on Thursday and Friday were relatively orderly, so we have to be on the lookout for another leg up at any moment. As far as support, I could see a retest of the November lows in the 740 – 750 range in the coming days, which would be an area I may look to get more aggressive on the long side. I don’t think we’ll go back and test the lows right away like we did back in October and early November. I’m looking for a similar move like we saw towards the end of November and through December with some kind of sideways move in the coming weeks, followed by another leg up, perhaps into the 900 – 950 range. That would get is into May and you know what that means.. sell in May and go away (or short the heck out of it)
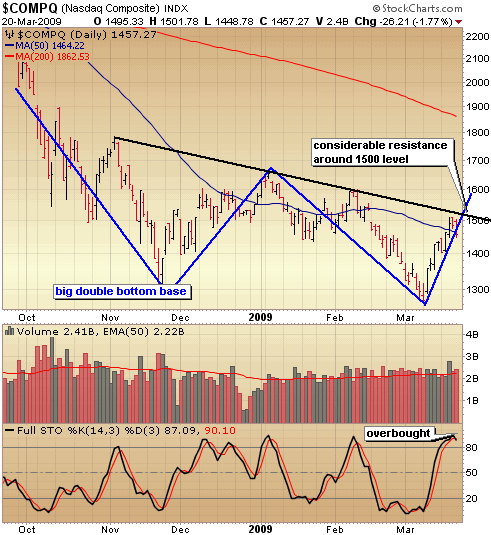
I mentioned the double bottom base last week and highlight it again here in blue. This is a large bullish pattern, but one that wouldn’t be confirmed until the Nasdaq breaks up through the January highs. A move like that may just signal the beginning of a new bull market, although I don’t see a move like happening until the latter half of this year at the earliest. First things first.. we’re very overbought up at these levels and also negotiating tough resistance in the Nasdaq around the 1500 level. The Nasdaq did clear resistance of the Jan lows as well as the 50 day moving average, so significantly bullish in the short term but we need to digest these gains a bit. Notice the Nasdaq dipped back below the 50 day moving average on Friday. A retest of support around the 1400 level wouldn’t come as much of a surprise and would be an area where I’d put on a significant amount of long exposure.
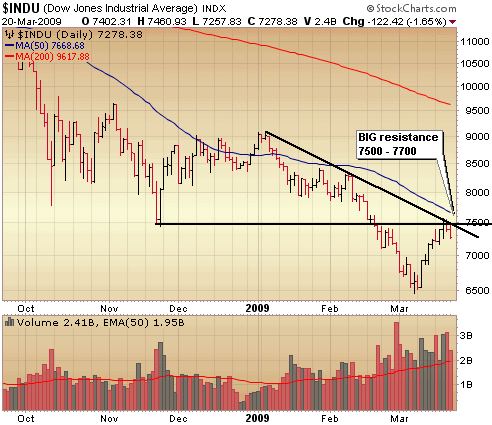
The Dow faces very difficult resistance as well around the 7500 level which is where the 2009 downtrend and the November lows converge. Combine that with the fact we’re considerably overbought and it’s dangerous to be too aggressive on the long side up here.
I have moved mostly to cash in the Self Investors Model Portfolio and will negotiate this tricky area of the market with very short term trading in the leveraged ETFs. Monday’s trading action will be interesting with speculation that Geithner will finally reveal the details of the TALF program as soon as Monday. Perhaps an announcement from Timmy that he’s stepping down would provide further fuel for the bulls to continue pushing this market higher. However, tempering the possible enthusiasm Monday will be news this weekend that 3 additional banks and 2 credit unions have been seized by regulators.
In terms of a specific trading strategy you’ll want to get a watch list of commodity plays together focusing on everything from gold to silver to oil. I’ll take a look the charts of gold and silver in a separate post this week. Both broke out with big volume immediately following the Fed move on Wednesday.
:::::::::::::::::::::::::::::::::::::::::::
Isn’t Time You Took Control of Your Financial Future?
The Self Investors Model Portfolio wrapped up 2006 with a gain of 27.6%, 2007 with a gain of 30.2%, finished nearly 35% ahead of the S&P in a very difficult 2008 and is off to a great start here in 2009, ahead of the S&P YTD performance by 16%. This is a REAL portfolio with position sizing and not based on extrapolated hypothetical gains for each trade. On average it beats the S&P by 20% per year. The result?
* Putting $100K into an S&P tracking index at the beginning of 2004 and you’re down more than $30K.
* The Self Investors Model in the same time period would have more than doubled your money. That’s the power of not buying and holding!
Would you like to receive buy and sell alerts in the Model Portfolio within minutes (NEW! now get them via instant messaging in near real time) of each transaction? You can receive these along with ALL of the tracking tools and video reports with the very popular Gold membership. Don’t delay, get started today and join me for many more highly profitable months here at SelfInvestors.com.
::: Best/Worst Performers :::
– Top 10 Performing Industries For the Week –
1. Silver: 25.30%
2. Broadcasting – Radio: 18.60%
3. Internet Service Providers: 17.30%
4. Textile Manufacturing: 16.15%
5. Jewelry Stores: 14.10%
6. Aluminum: 13.00%
7. Gold: 12.25%
8. Music & Video Stores: 12.10%
9. Recreational Goods: 11.00%
10. Building Materials Wholesale: 10.35%
– Top 10 Worst Performing Industries For the Week –
1. REIT – Residential: -12.15%
2. REIT – Hotel/Motel: -11.10%
3. REIT – Retail: -10.50%
4. REIT – Diversified Industrial: -9.20%
5. REIT – Healthcare Facilities: -9.00%
6. REIT – Office: -7.90%
7. Major Airlines: -7.70%
8. Mortgage Investment: -7.50%
9. General Contractors: -6.80%
10. Home Health Care: -6.75%
– Top 5 Best Performing ETFs For the Week –
(excluding leveraged ETFs)
1. HLDRS Regional Banks (RKH) 44.75%
2. SPDR Series Trust (KBE) 37.38%
3. SPDR Financials (XLF) 32.50%
4. PowerShares Private Equity (PSP) 22.90%
5. iShares Broker Dealer (IAI) 22.65%
– Worst 5 Performing ETF’s –
1. iShares Malaysia (EWM) -2.95%
2. iShares 20 Yr Treasuries (TLT) -1.45%
3. US Oil Fund (USO) -1.30%
4. iShares Gold (IAU) -1.25%
5. SPDR Gold (GLD) -1.05%
::: Upcoming Economic Reports (3/23/2009- 3/27/2009) :::
Monday: Existing Home Sales
Tuesday: None
Wednesday: Durable Goods Orders, New Home Sales, Crude Inventories
Thursday: GDP, Initial Claims
Friday: Personal Income/Spending, Mich Sentiment
::: Earnings I’m Watching This Week :::
Wednesday: SolarFun (SOLF), WuXi Pharma (WX)
Thursday: GameStop (GME)
Friday: KB Homes (KBH)


