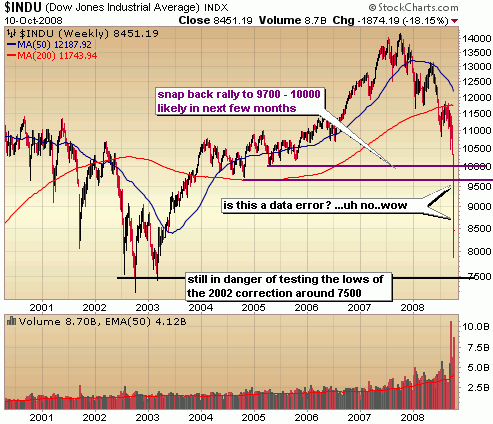
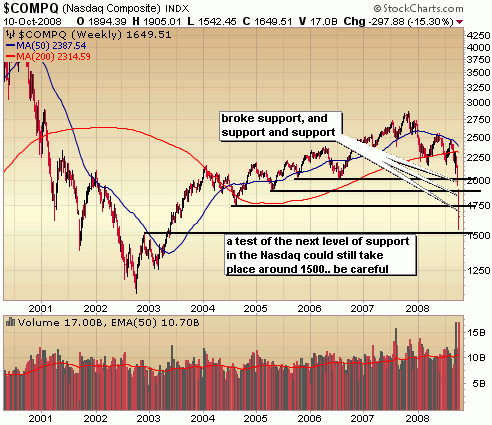
Words can’t really describe the action of the past week, but pictures certainly can. You just have to take a look at the big picture charts of the major indices to get a sense of the historic meltdown in the markets that was last week. In terms of a sustained move down with no breather along the way, I’d imagine we aren’t likely to see a move like that again over the course of a week EVER again.. at least I hope so. It really does look like a data error. Here are the nearly 10 year weekly charts of the major indices for a comparison to the tech crash. As you can see the Down Jones move is much more vertical and severe this time around. Mind boggling really.
While we did see some positive action on Friday with a fairly massive capitulation attempt (more on this in a bit), my concern is that we closed in the lower half of the weekly range and in my opinion are still in danger of testing the lows of the previous correction around 7500. However, I do believe we are mighty close to a major bottom and massive snap back rally.
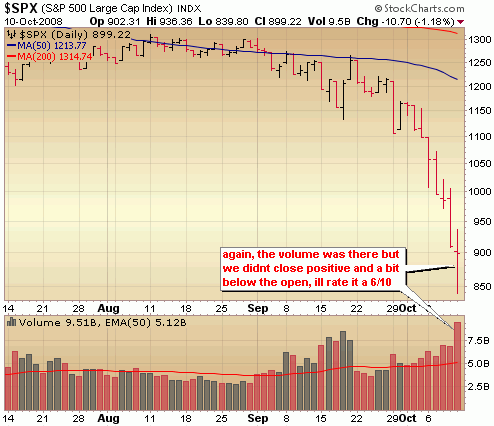
Same goes for the S&P. It’s such a tough market to play right now because we really are in no man’s land a bit with the weekly close in the lower half of the range and in between the next level of support around the 2002 lows and the nearest level of resistance around 1050.
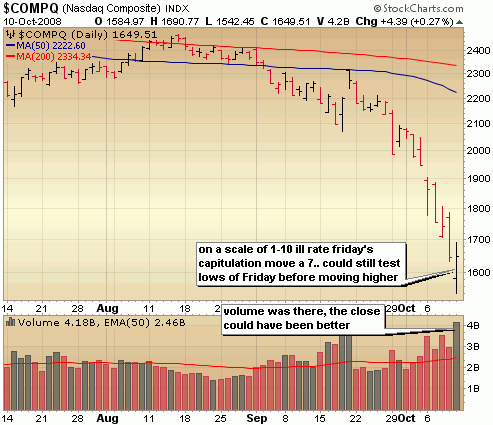
The Nasdaq still has a major support level (around 1500) in its path before a test of the 02 lows come into play. We could very well test 1500 before a major rally ensues so it’s best to remain cautious here.
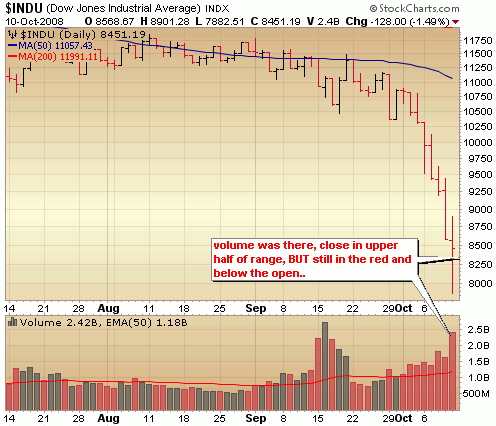
So why am I a bit skeptical that Friday’s low was "THE" bottom of this correction? As I discussed above we still closed in the lower half of the weekly range, but in addition to that, the capitulation move on Friday was a bit lackluster. As you’ll see in the charts below, the volume was certainly there, the spike in fear as measured by the VIX was historic and the close did occur in the upper half of the intraday trading range, but the end of day buying fizzled in the last 30 minutes as the Dow and S&P closed in the red. I really wanted to see the indices close up big near the highs of the day. I believe we’ll probably get some kind of follow through to the upside over the next few days but pay attention to volume on the buy side and be mindful of the fact the indices are still in danger of testing the lows of the tech bubble crash.
I personally have been nibbling on some commodity plays while doing my best to stay hedged with ultra short ETFs and may nibble some more on small long positions on any light volume pull backs from here. An major moves up with light volume and I’ll be adding hedge positions. The bottom line right now is that it’s very difficult to play either side and for most people you’re going to want to wait for this market to stabilize a bit and show more signs of strength.
::: Model Portfolio :::
** This section will now appear as a separate report about every other Wednesday.
The Self Investors Model Portfolio wrapped up 2006 with a gain of 27.6%, 2007 with a gain of 30.2% and is nearly 30% ahead of the S&P in a very difficult 2008. This is a REAL portfolio with position sizing and features annualized returns of 24%.
Would you like to receive buy and sell alerts in the Model Portfolio within minutes (NEW! now get them via instant messaging in near real time) of each transaction? You can receive these along with ALL of the tracking tools and video reports with the very popular Gold membership. Don’t delay, get started today and join me for many more highly profitable months here at SelfInvestors.com.
::: Best/Worst Performers :::
– Top 10 Performing Industries For the Week –
1. Trucking: 1.05%
2. Sporting Goods Stores: .85%
3. Personal Computers: -1.05%
4. Agricultural Chemicals: -3.00%
5. Rubbers & Plastics: -4.85%
6. REIT – Office: -5.10%
7. Consumer Services: -5.75%
8. Tobacco Products: -5.80%
9. Education & Training Services: -5.80%
10. Auto Parts Wholesale: -5.85%
– Top 10 Worst Performing Industries For the Week –
1. Long Term Care Facilities: -33.60%
2. Aluminum: -30.50%
3. Nonmetallic Mineral Mining: -27.90%
4. Life Insurance: -27.40%
5. Diversified Investments: -26.70%
6. Oil & Gas Independent: -26.45%
7. Oil & Gas Equipment & Services: -25.75%
8. Auto Manufacturers Major: -25.70%
9. Oil & Gas Drilling & Exploration: -25.70%
10. Surety & Title Insurance: -25.00%
– Top 5 Best Performing ETFs For the Week –
1. Central Fund of Canada (CEF) 6.15%
2. Gold Trust (GLD) .75%
3. Ishares Gold (IAU) .65%
.. rest are bond funds
– Worst 5 Performing ETF’s –
1. Latin America (LDF) -39.05%
2. India Fund (IFN) -38.10%
3. Mexico Fund (MXF) -36.40%
4. Chile Fund (CH) -36.15%
5. Turkish Invest Fund (TKF) -35.65%
::: Upcoming Economic Reports (10/13/2008- 10/17/2008) :::
Monday: Treasury Budget
Tuesday: None
Wednesday: PPI, Retail Sales, Business Inventories, Crude Inventories, Fed Beige Book
Thursday: CPI, Initial Claims, Capacity Utilization, Industrial Production, Philly Fed
Friday: Building Permits, Housing Starts
::: Earnings I’m Watching This Week :::
Monday: Fastenal (FAST)
Tuesday: Genentech (DNA), Intel (INTC), Johnson & Johnson (JNJ)
Wednesday: Abbott Labs (ABT), Badger Meter (BMI), Ebay (EBAY), JP Morgan (JPM), Lufkin Industries (LUFK), St Jude Medical (STJ), Coca Cola (KOL), Wells Fargo (WFC)
Thursday: Citigroup (C), Danaher (DHR), Gilead Sciences (GILD), Google (GOOG), Hdfc Bank (HDB), Informatica (INFA), Intuitive Surgical (ISRG), Merrill Lynch (MER), Nokia (NOK), Stryker (SYK), Sunpower (SPWRA)
Friday: Honeywell (HON), Satyam Computer (SAY), Schlumberger (SLB)
