Free Stock Market Research, Analysis & Commentary
Head over to the blog and get free award winning research, commentary and analysis of the overall market, breakout stocks, industries, ETF’s and IPO’s throughout the week. Regular posts include breakout stock of the day, top performing industries and ETF’s, general market commentary and technical analysis, performance of leading stocks and much more. See why Forbes named it a “Best of Web” candidate and CNN/Money rated it a top 10 financial blog. Featured at:
![]()
![]()
![]()
![]()
![]()
Breakout Stocks, IPO and ETF Tracking
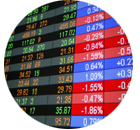
With over 10,000 stocks, IPO’s and ETF’s to choose from, tracking the market can be an overwhelming task. You can be adept at ![]() researching the fundamentals and reading the chart movements, but if you don’t have a consistent tracking system in place, it is difficult to find consistent success. The Breakout Tracker is a custom system that I have spent thousands on building from the ground up and designed to alert you to the highest quality stocks breaking out of sound bases or pulling back to major support, ETF’s where the big money is flowing and only the best IPO’s the market has to offer. All stocks are analyzed and ranked by me before they ever make it to the database, guaranteeing you have only a database of the best. The Breakout Tracker combines the power of the human element of stock research with the updating, sorting and filtering capabilities of a dynamic database, alerting you to buying opportunities in the highest quality stocks in just minutes day!
researching the fundamentals and reading the chart movements, but if you don’t have a consistent tracking system in place, it is difficult to find consistent success. The Breakout Tracker is a custom system that I have spent thousands on building from the ground up and designed to alert you to the highest quality stocks breaking out of sound bases or pulling back to major support, ETF’s where the big money is flowing and only the best IPO’s the market has to offer. All stocks are analyzed and ranked by me before they ever make it to the database, guaranteeing you have only a database of the best. The Breakout Tracker combines the power of the human element of stock research with the updating, sorting and filtering capabilities of a dynamic database, alerting you to buying opportunities in the highest quality stocks in just minutes day!
| See a detailed look at the stock tracking system! |
SelfInvestors.com Model Portfolio
An actively managed “real world” model portfolio – NOT a list of hypothetical gains you’ll see touted on many websites. Very few services are willing to put their reputation on the line, put some skin in the game and run a real portfolio. Here at SelfInvestors.com you’ll receive buy and sell alerts for every transaction made in the portfolio and an archived history of every trade made over the past 3 years.
Premium Video Presentations

The premium video presentations are designed to highlight the best opportunities the market has to offer and review the holdings of the Model Portfolio. While the Breakout Tracker (see above) guides you in discovering breakout stocks on your own, these reports pick out a few of the best the database is spitting out and taking the analysis one step further by providing commentary and technical analysis. In addition, I highlight Quick Strike Profit swing trades, shorting opportunities and exchange traded funds (ETF’s). Varying market conditions call for different tools for profiting! Not only will I discuss the best opportunities in the market, but I’ll review those positions initiated in the Self Investors Model Portfolio so you’ll have an idea of where I’m looking to exit the trade.
 Real Time Charting & Chatting
Join me, other SelfInvestors.com members and some of the best stock traders in the world in a real time charting and chatting environment. As a Platinum member of SelfInvestors.com you’ll have access to a private chat room where you’ll get trade ideas throughout the trading day in real time. Imagine hiring a personal trading consultant throughout the trading day, every trading day. You’d expect to pay thousands upon thousands of dollars every year right? SelfInvestors.com makes a service like this affordable for traders just starting out. Drastically accelerate your trading skills with this service.. in just a few months you’ll be well on your way to consistent profits.
Note From the Founder, Tate Dwinnell
First of all, welcome to SelfInvestors.com, a website I’ve been building and improving over the last few years to help cut through all the clutter out there. I know how valuable your time is. I also know that information overload can significantly decrease your portfolio performance. My name is Tate Dwinnell and I’m a self investor just like you. Early on in my investment endeavors (I think you can relate), I spent considerable time and money using various services, reading various publications, etc. It wasn’t until I began to focus on the common characteristics of the most successful investing methods as well as working as a researcher for CANSLIM.net that I began to realize what kind of service I was looking for in order to stay on top of the market. It wasn’t available, so I spent the past couple years building it myself.. just the way I wanted it… and I look forward to sharing it with you.
UPDATE: The SelfInvestors.com trading services are no longer available. Thank you to all my members over the years and those I have met in the industry. It was a blast but now on to new endeavors! (not to mention sleeping in .. no more 5AM waking to get ready for the market open 🙂 See my new project creating gallery quality wall art with my brother at www.bumblejax.com You’ll also find me posting about various things related to web development, ecommerce, the stock market, biohacking, health, travel and anything else that currently interests me at www.infoboil.com
See you on the inside!

Tate Dwinnell
Founder, Self Investors LLC