Everybody wants to know where gold is headed and it remains one of the most talked about trades. More recently I’ve begun to hear family and friends discuss purchasing gold stocks and the actual metal itself. That usually doesn’t bode well for any trade especially after the run gold has had. So where might it be headed in the coming weeks and months?
As always, I turn to the charts for some clues and Adam from Market Club gives us a video analysis as well. While he uses some different indicators, we both arrive at about the same conclusion.. that gold is still undergoing a correction and the best strategy is to step aside until a new buy signal is provided.
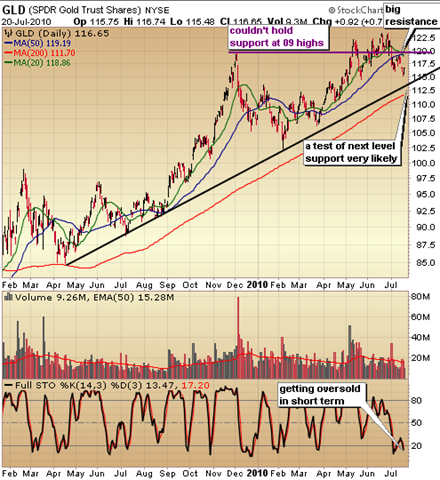
Below is a chart of the SPDR Gold Trust (GLD) which seeks to track the price of gold. You’ll notice the parabolic move at the end of last, followed by a 20% correction and return to test the all time highs. While gold held up at those lofty levels for nearly two months, it has since taken out support at the 2009 highs and is in the process of a correction.
It’s anyone’s guess just how far gold will correct, but considering support at the 2009 high was taken out and the 50 day moving average (in blue) is now acting as resistance, it becomes a high probability that the next level of support will be tested. That level is right around where the uptrend line off the March 09 low and the 200 day moving average converge around the 112 – 114 level. I have no interest in gold stocks until that level is reached and even then, I’d be hesitant in getting aggressive. I believe the odds are good for a much deeper correction, possibly to around the 100 level in GLD.
If the GLD hits around the 113ish level, I’ll be looking to swing trade gold stocks for a few weeks with the idea it could run up and retest resistance around the 120 level, but I’d be taking profits should that move occur. Given the parabolic rise of last year and what could be a big double top, gold needs to undergo a lengthy digestion of gains. Over the next several months I’d rather be in nat gas and oil.
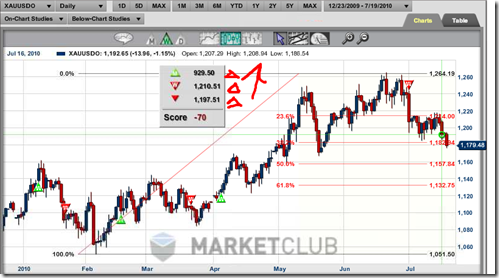
For another perspective on gold, Adam Hewison of Market Club discusses the fibonacci levels, MACD and their trade triangle indicators to determine where gold may be headed. Click the chart to play the video.