About once a week I like to run through about 200 of the most liquid ETF’s to get a better sense of the market. A good picture of the market can be painted by scanning through them so I thought I’d share my thoughts on what I’m seeing (in no particular order). What are you seeing?
I post my thoughts on the general market in my weekly reports on Sunday, so won’t discuss it in detail again here but considering the futures are way off and tomorrow could get ugly I’ll just mention that just maybe tomorrow sets us up for that massive capitulation day that marks an intermediate bottom. Pay attention to the VIX. Remember: it’s not how we open but we we close. If on Tuesday, we don’t at the very least close in the upper half of the trading range it could get real ugly. There is quite a bit of room to run to the downside before any support comes into play.
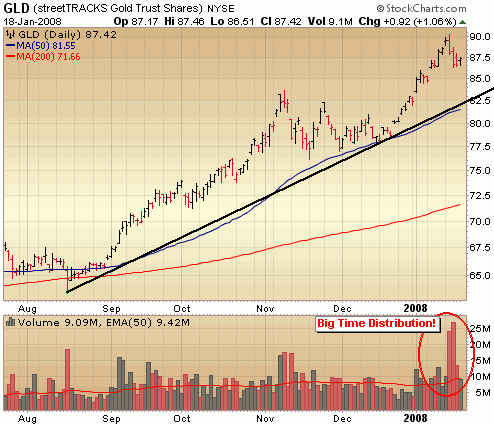
Gold is up 35% in 5 months and big distribution has come into the Streettracks Gold Trust (GLD) in the last few trading sessions. Take some profits already!
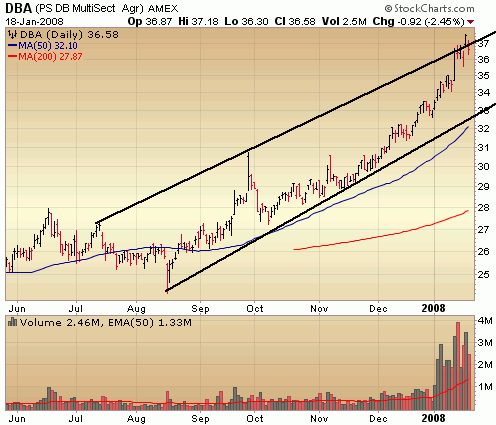
The agriculture stocks are not immune to the heavy selling and many of the top performers such as MOS, TNH, MON, CF, TRA and DE have been hit with big time institutional selling in recent days. Is the Powershares Agriculture Fund (DBA) next to go? It isn’t showing any signs of deterioration yet, but keep an eye on it for a short. It’s extremely overbought and hitting the top of an upward channel.
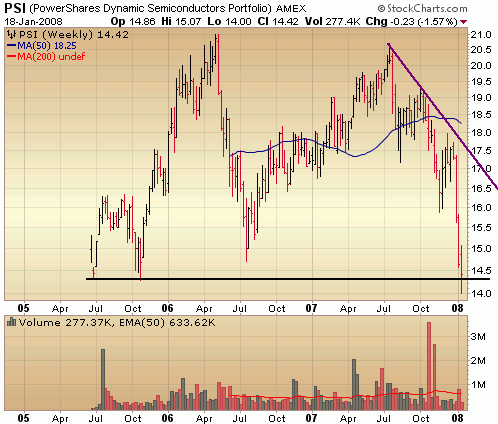
Semis are severely oversold. I’m not saying that can’t stay oversold and dip further. I’m just sayin. It will take Intel several months to recover from that slaughtering. Maybe semis become interesting later this year. The Powershares Dynamic Semis (PSI) ETF is hitting some key resistance it might be ready for a snap back rally. But that’s about it.
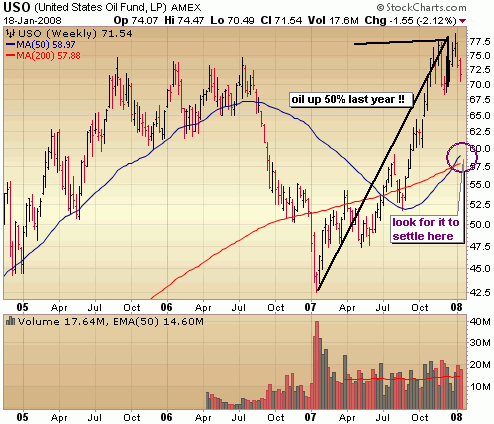
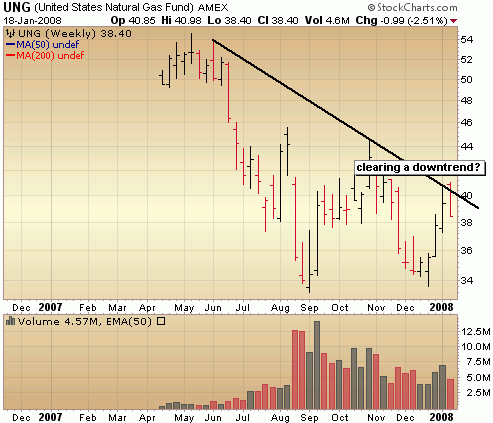
Divergence between oil and natural gas. As oil breaks down and retreats from $100/barrel, natural gas appears headed the other way and on the verge of breaking out. It’s hard to believe oil was up 50% this year. I hadn’t realized that. I see retrace of that run for the US Oil Fund to the $60 range.
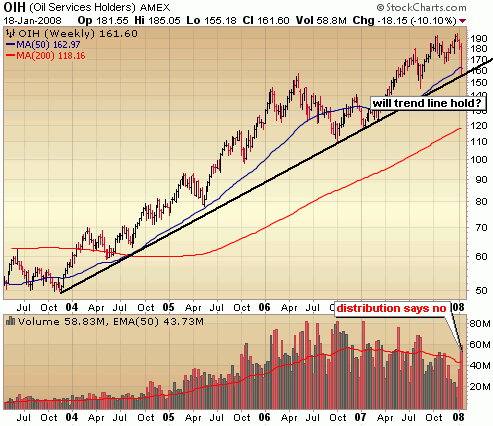
.. and that brings me to Oil Service stocks which are approaching a long term trend line. It’s holding there now but given the distribution going on these names it’s just a matter of time before before the Oil Services Holders (OIH) takes out that long term trend line. Oil Service stocks look done to me over the next few months.
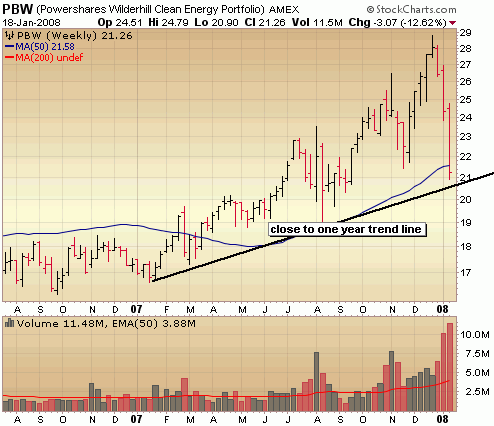
.. and that brings me to alternative energy which tends to trade in line with oil. The great diversified way to play alternative way is the Powershares Clean Energy (PBW) ETF. Solar stocks have been killed in the past few weeks and I have to admit some of them are beginning to flash interesting long term entry points. It’s too soon just yet to get in, but they are worth paying attention to as is PBW. Below is a weekly chart and you see it’s closing in on a trend line. However, that is huge distribution going on. Avoid at least until it begins to stabilize.
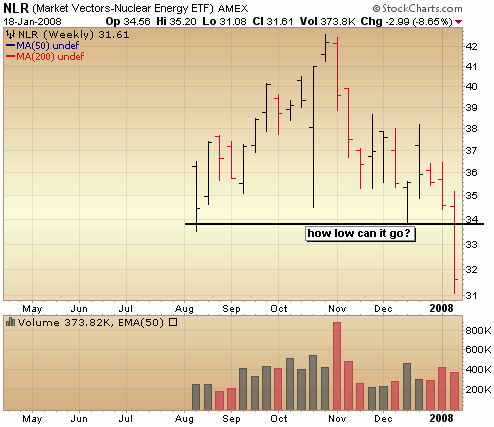
..and on the non renewable side of alternative energy we have nuclear, a source of much debate. France is doing the right thing with nuclear and largely energy independent. Nuclear energy traders are probably realizing it will be a long time before nuclear becomes a larger part of our energy source.
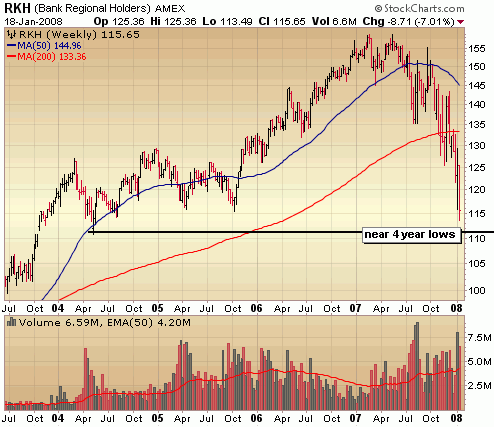
Everyone wants to know when homebuilders and banks will bottom. I’ve touched on the homebuilders recently as they have begun to stabilize and it appears that the banks (at least the smaller regional ones) have begun to stabilize a bit. Notice how I’m not calling a bottom. Downward trendlines will need to be broken for that to happen and we’re quite a ways from that. Note the capitulation 2 weeks ago on the weekly chart of the Regional Bank Holders (RKH) and a retracing of that move with lighter volume last week. That is healthier action. Look for support near the 4 year lows.
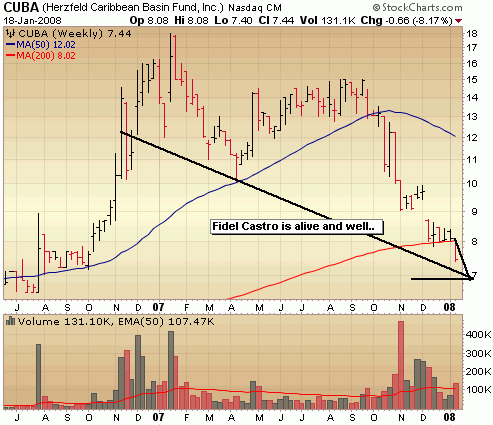
Fidel Castro is alive and well. Ok maybe not well but he’s alive and that’s more than I can say for the Herzfeld Caribbean Basin Fund (CUBA).
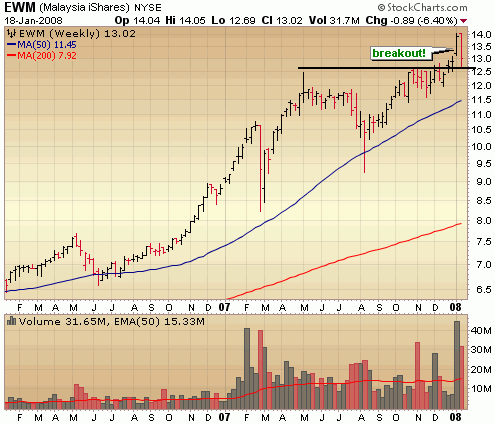
On the other side of the world Malaysia is flying high and defying gravity as the rest of the world crumbles. Maybe it’s next in line.
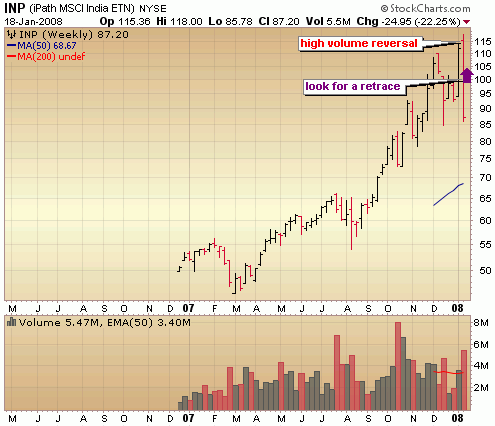
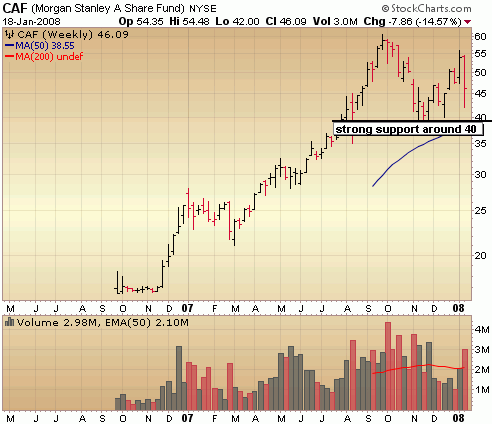
Emerging market high flyers China and India are another story and have the potential to be punished the most. Looking at the big picture both have a long way to go before you could say serious damage has been inflicted. In fact the Morgan Stanley A Shares Fund (CAF) could drop nearly another 15% and still be considered a bullish looking chart in terms of the long term picture.
Looks to me like India has just begin its deterioration and may provide a great short entry soon. INP will be down big on Tuesday so it may be some time before providing a good entry. Note the potential top marking high volume reversal on the weekly chart in the iPath MSCI India ETF last week. I’d be looking to get short on a retrace of this move somewhere in the 100 to 105 range.