The indices finally began to show some signs of life last week with a firm break of the October downtrend. While I have been increasingly bullish on this market, I did not expect the market to rally with such force as it did on Tuesday ahead of the GDP number, the Fed decision and the coming election.
On Monday night I said to members:
To be completely cliche, I’m still cautiously optimistic on this market as sell volume continues to dry up following minor
capitulation days on October 10th and October 16th. However, we must get going very soon with a big confirmation move up. The longer the indices probe the October lows, the more likely they are going to plunge further. The Nasdaq did close below the intraday low of the October 10 capitulation day today which is of concern but it may just find support at 1500 so keep an eye on that level tomorrow. We certainly aren’t out of the woods for another significant move lower, so be careful out there.
We sure did get going! The indices held the nearly 900 point move in the Dow on Tuesday and managed to tack on more gains throughout the week despite awful consumer sentiment numbers and a negative GDP (although better than expected). Certainly the easing TED spread and Libor rates have helped stabilize this market and provided a foundation for a rally, but shrugging aside bad news and rallying is certainly one important characteristic of a bottom.
Here are some points I made to my members on Thursday night regarding the current market:
– the character of this market appears to be changing ever so
slightly, becoming somewhat resilient in the face of bad news
– the indices have cleared the October downward trends, also bullish
– in the short term, the indices appear to be tiring a bit and may
need to take a bit of a rest heading into Tuesday election
– the Dow is ONLY 1100 points or so from major resistance of the 200
day moving moving average! That kind of move nearly happened in one
day this week.
– (i’ll add this note here now) regarding the election, I’d imagine the only way the market rallies big the morning after the election is if McCain pulls out the upset victory. On the flip side much of an Obama victory is probably already priced in so we could rally a bit just simply for the fact that the uncertainty of the election is over. However, I think in either case, any rally would be relatively short lived considering the move we already had last week.
Lets go ahead and take another look at the charts:
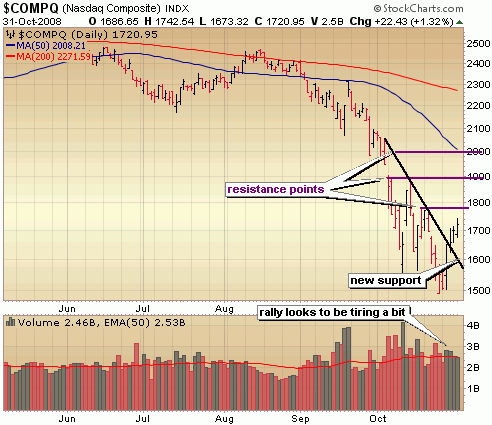
As you’ll see in all the charts below, the October downtrends have been taken out which is an important first step, but as you’ll also see we’ve come a bit too far too fast and volume diminished on the buy side as the week wore on. It’s quite possible that soon we will need to digest the big ramp up that began on Tuesday, retracing as much as half the move and testing what is a new support area of the Oct downtrend line.. in this case around 1600 in the Nasdaq. Note the overhead resistance points above around 1800, 1900 and 2000. I do think its a bit late to be adding long positions right here.. wait for a pull back. There will be plenty of opportunity, just wait for your price.
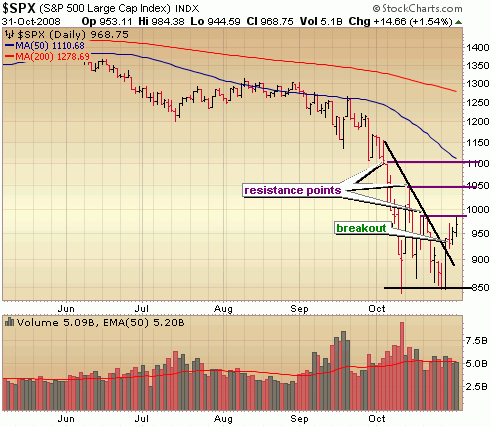
Same thing with the S&P.. technicals have improved but we’re getting overbought in the short term and need to come in some.
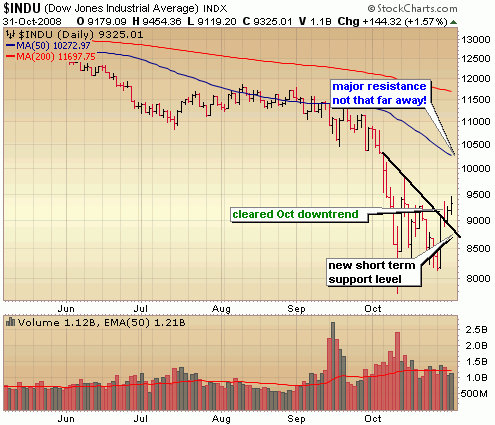
The Dow pushed above that October downtrend line as well and tacked on more gains heading into the weekend, but it does appear to be tiring and probably needs to come back and test new support at the trendline around 8700 or so. Keep in mind – one more more big move like we had on Tuesday and the Dow is already at major resistance of the 200 dma around 10250. It’s at that point that I exit and move almost entirely to cash again.
I will continue adding long exposure on healthy pull backs from current levels. This coming week is very important. We need to hold this rally reasonably well with healthy, lighter volume pull backs, keeping the potential for an end of year really alive. We are entering what is historically a good time of year for the market, so the bulls have some things working for them.. finally.
::: Model Portfolio :::
** This section will now appear as a separate report about every other Wednesday.
The Self Investors Model Portfolio wrapped up 2006 with a gain of 27.6%, 2007 with a gain of 30.2% and is nearly 30% ahead of the S&P in a very difficult 2008. This is a REAL portfolio with position sizing and features annualized returns of 24%.
Would you like to receive buy and sell alerts in the Model Portfolio within minutes (NEW! now get them via instant messaging in near real time) of each transaction? You can receive these along with ALL of the tracking tools and video reports with the very popular Gold membership. Don’t delay, get started today and join me for many more highly profitable months here at SelfInvestors.com.
::: Best/Worst Performers :::
– Top 10 Performing Industries For the Week –
1.Resorts & Casinos: 30.45%
2. Office Supplies: 25.80%
3. Gold: 25.00%
4. Agricultural Chemicals: 24.20%
5. Education & Training Services: 23.05%
6. Mortgage Investment: 19.55%
7. Residential Construction: 18.05%
8. Steel & Iron: 18.00%
9. Copper: 17.90%
10. Heavy Construction: 17.75%
– Top 10 Worst Performing Industries For the Week –
1. Health Care Plans: -11.55%
2. Meat Products: -7.90%
3. Research Services: -7.60%
4. Textile Manufacturing: -7.45%
5. Appliances: -6.50%
6. Internet Service Providers: -5.55%
7. Drugs Wholesale: -5.50%
8. Manufactured Housing: -4.75%
9. Air Services: -3.60%
10. Semis – Memory Chips: -3.05%
– Top 5 Best Performing ETFs For the Week –
1. Market Vectors Russia (RSX) 28.90%
2. Market Vectors Gold Miners (GDX) 24.65%
3. iShares South Korea (EWY) 23.45%
4. Mexico Fund (MXF) 23.30%
5. iShares South Africa (EZA) 21.70%
– Worst 5 Performing ETF’s –
1. Indonesia Fund (IF) -13.80%
2. US Oil Fund (USO) -4.60%
3. iShares Healthcare (IHF) -2.65%
4. China Fund (CHN) -2.60%
5. iShares Commodities (GSG) -2.15%
::: Upcoming Economic Reports (11/3/2008- 11/7/2008) :::
Monday: Construction Spending, ISM Index
Tuesday: Auto/Truck Sales, Factory Orders
Wednesday: Crude Inventories, ISM Services
Thursday: Productivity, Initial Claims
Friday: Average Workweek, Hourly Earnings, Nonfarm Payrolls, Unemployment Rate, Wholesale Inventories
::: Earnings I’m Watching This Week :::
Monday: Atlas Energy Resources (ATN), Automatic Data Processing (ADP), Comstock Resources (CRK), Forest Oil (FST), Iconix Brands (ICON), Mastercard (MA), Open Text (OTEX), Sun Hydraulics (SUNH), Taleo Corp (TLEO), Transact Tech (TACT),
Tuesday: American Medical Systems (AMMD), Jacobs Engineering (JEC), Petroquest (PQ), W&T Offshore (WTI)
Wednesday: Clean Harbors (CLHB), Cisco (CSCO), Cognizant Technology (CTSH), Corinthian Colleges (COCO), Enersys (ENS), FTI Consulting (FCN), Gafisa (GFA), LMIA Aerospace (LMIA), Partner Communications (PTNR), Quicksilver Gas (KGS), Solera Holdings (SLH), T Three Energy Services (TTES), Transocean (RIG), Ultra Petroleum (UPL)
Thursday: AirMedia (AMCN), AthenaHealth (ATHN), Bancocolombia (CIB), Capella Education (CPLA), Carrizo Oil & Gas (CRZO), China Digital TV (STV), Continental Resources (CLR), Darling International (DAR), Exide Technologies (XIDE), Ezcorp (EZPW), Fuel Systems Solutions (FSYS), FMC Technologies (FTI), Genoptix (GXDX), Gulfport Energy (GPOR), Hansen Natural (HANS), Innerworkings (INWK), IPG Photonics (IPGP), Lumber Liquidators (LL), NIC Inc (EGOV), Priceline.com (PCLN), SandRidge Energy (SD), Nasdaq Group (NDAQ), True Religion (TRLG)


Unless i am mistaken the 50 day sma is about 10300 and the 200 day sma is about 11600.
yes Jim, thanks for pointing that out.. I goofed – meant to say 50 dma.